ECON323 Quantitative Economic Modeling with Data Science Applications Problem Set 5
Problem Set 5
See Introduction and Basic Functionality
import pandas as pd
import numpy as np

%matplotlib inline
Setup
These questions use data on daily Covid cases in health regions in Canada from the COVID-19 Canada Open Data Working Group.
url = "https://github.com/ccodwg/Covid19Canada/raw/master/timeseries_hr/cases_timeseries_hr.csv"
try : # only download if cases_raw has not already been defined
    cases_raw
except:
    cases_raw = pd.read_csv(url, parse_dates=["date_report"])

try :
    hr_map
except:
    hr_map = pd.read_csv("https://github.com/ccodwg/Covid19Canada/raw/master/other/hr_map.csv")
Now, we create cases per 100,000 and then do the same manipulation as in the pandas basics lecture. We will focus on BC health regions in this problem set.
cases_raw
cases_bc = cases_raw.loc[(cases_raw['province'] == 'BC') &
                         (cases_raw['date_report'] < pd.to_datetime('2022-01-01')) &
                         (cases_raw['date_report'] >= pd.to_datetime('2021-01-01')),:] # Take the data for BC in year 2021 only

# create cases per 100,000
cases_bc = cases_bc.merge(hr_map[['province','health_region','pop']],
                          on=['province','health_region'],
                          how='left')
cases_bc['cases100k'] = cases_bc['cases'] / cases_bc['pop'] * 100_000
cases_bc = (
    cases_bc.reset_index()
    .pivot_table(index='date_report',columns='health_region', values='cases100k')
)
cases_bc
The resulting cases_bc DataFrame contains Covid cases per 100,000 population for each BC health region and day, in 2021.
Question 1
Transform the cases and cases100k columns by taking their absolute value. At each date, what is the minimum number of cases per 100,000 across health regions?
What was the (daily) median number of cases per 100,000 in each health region?
What was the maximum number of cases per 100,000 across health regions? In what health region did it happen? On what date was this achieved?
Hint 1: What Python type (not dtype) is returned by a reduction? Hint 2: Read documentation for the method idxmax.
Classify each health region as high or low volatility based on whether the variance of their cases per 100,000 is above or below 100.
Question 2
Imagine that we want to determine whether cases per 100,000 was High (> 10), Low (0 < x <= 10), or None (x = 0) for each health region and each day.
Write a Python function that takes a single number as an input and outputs a single string which notes whether that number is High, Low, or None.
Pass your function to either apply or applymap and save the result in a new DataFrame called case_bins.
Question 3
This exercise has multiple parts:
Use another transformation on case_bins to count how many times each health region had each of the three classifications.
Hint 1: Will you need to use apply or applymap for transformation? Hint 2: value_counts
Construct a horizontal bar chart (you can refer to an example of horizontal bar chart here) to detail the occurrences of each level. Use one bar per health region and classification for 15 total bars.
Question 4
For a single health region of your choice, determine the mean cases per 100,000 during “High” and “Low” case times. (recall your case_bins DataFrame from the exercise above)
Which health regions in our sample performs the best during “bad times" ? To determine this, compute each health region’s mean daily cases per 100,000 where the daily cases per 100,000 is greater than 10 (i.e., in the "high" category as defined above).
Questions 5-8
Run the following code to load a cleaned piece of census data from Statistics Canada.
df = pd.read_csv("https://datascience.quantecon.org/assets/data/canada_census.csv", header=0, index_col=False)
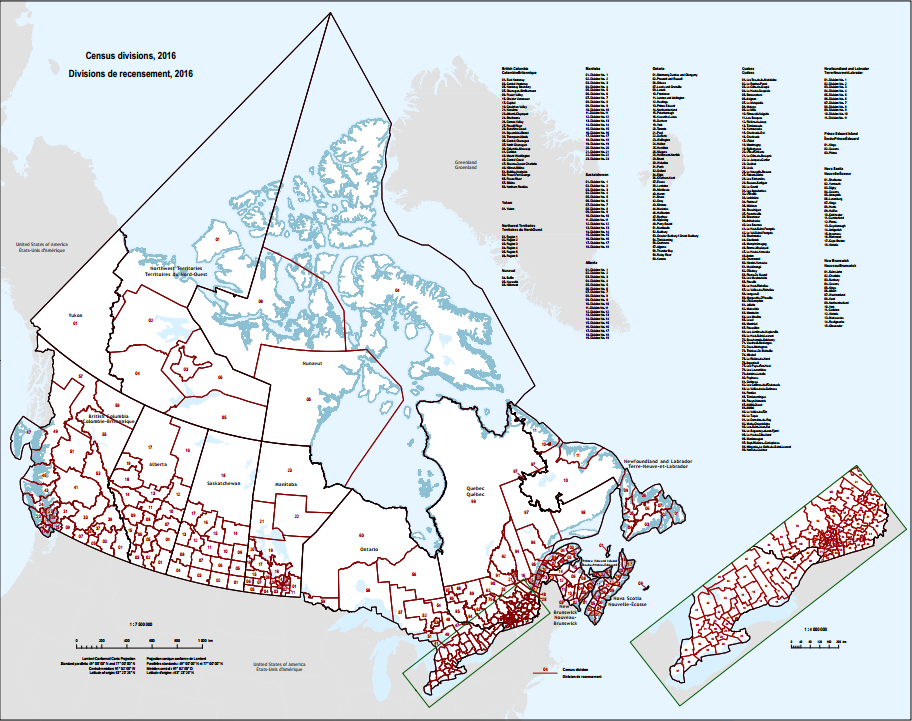
df.head()A census division is a geographical area, smaller than a Canadian province, that is used to organize information at a slightly more granular level than by province or by city. The census divisions are shown below.
https://datascience.quantecon.org/_static/canada_censusdivisions_map.png
The data above contains information on 1) the population, 2) percent of population with a college degree, 3) percent of population who own their house/apartment, and 4) the median after-tax income at the census division level.
Question 5
Run the code below to create a separate data source with province codes and names.
df_provincecodes = pd.DataFrame({
    "Pname" : [ 'Newfoundland and Labrador', 'Prince Edward Island', 'Nova Scotia',
                'New Brunswick', 'Quebec', 'Ontario', 'Manitoba', 'Saskatchewan',
                'Alberta', 'British Columbia', 'Yukon', 'Northwest Territories','Nunavut'],
    "Code" : ['NL', 'PE', 'NS', 'NB', 'QC', 'ON', 'MB', 'SK', 'AB', 'BC', 'YT', 'NT', 'NU']
            })
df_provincecodes
With this,
Either merge or join these province codes into the census dataframe to provide province codes for each province name. You need to figure out which “key” matches in the merge, and don’t be afraid to rename columns for convenience.
Drop the province names from the resulting dataframe.
Rename the column with the province codes to “Province”. Hint: .rename(columns =
Question 6
Which province has the highest population? Which has the lowest?
Question 7
Which province has the highest percent of individuals with a college education? Which has the lowest?
Hint: Remember to weight this calculation by population!
Question 8
By province, what is the total population of all census divisions in which more than 80 percent of the population own houses?


